What-if analysis refers to a group of financial modeling techniques designed to answer a simple question: “What if this happens?” These allow you to forecast potential outcomes, which you can use to make better-informed decisions.
This kind of forward-looking insight can be invaluable for small and midsize businesses (SMBs), especially in periods of uncertainty—like 2025, when the word “uncertainty” was mentioned in 87% of Q1 earnings calls, compared to 38% in Q4 of 2024.
Let’s explore what you should know about what-if analysis, including the different types, their most significant benefits and their most common use cases. We’ll also walk through a step-by-step example to demonstrate how it works.
What Is What-If Analysis?
What-if analysis is the process of using financial modeling to explore how changes in key independent variables might impact financial outcomes. As the name suggests, it involves asking “what if” questions and building models to forecast the results.
For example, you might use what-if analysis to consider questions like:
- How would raising prices by 3%, 5% or 7% affect revenue?
- What happens to profit margins if supplier costs increase 15%?
- How much more runway would we have if we delay hiring to next quarter?
Importantly, what-if analysis is more than simply exploring those what-if scenarios at a theoretical level. It requires hands-on modeling and detailed calculations to ground your considerations in hard numbers.
Depending on the type of what-if analysis, you might assess the effects of making changes to a single, targeted variable or the impact of fluctuations across multiple assumptions simultaneously.
Scenario Planning vs. What-If Analysis
Scenario planning is the type of what-if analysis that involves studying the effects of changes in multiple variables at once. That may include a range of market and economic conditions, such as supplier costs, tax policy or disruptions from competition.
This helps company leaders understand how different versions of the future might play out, typically including best-case, worst-case and most likely outcomes. As a result, it’s most useful for long-term strategy and preparing for uncertainty at the entity level.
Scenario planning stands in contrast with sensitivity analysis, the other main form of what-if analysis. It only considers the impact of changes in a single variable—like pricing or headcount—helping to show how sensitive your forecasts are to that one assumption.
As a result, sensitivity analysis typically lends itself to answering more focused questions, making it best suited to informing short-term, tactical decision-making.
Benefits of What-If Analysis for SMBs
Whether it’s shifting market conditions or variable cash flows, uncertainty is a near constant for SMBs. What-if analysis is a powerful way to manage that uncertainty, helping you anticipate potential outcomes and make better-informed decisions.
For example, before raising prices, you can use what-if analysis to test how different increases affect revenue and customer churn. That way, you can better identify the sweet spot that maximizes profitability.
In other words, what-if analysis allows you to take a more proactive management approach. Instead of reacting to disruptions as they occur, you can take steps to mitigate expected risks in advance, promoting resilience and agility.
In addition to strengthening risk management, this can help support your growth strategy. It allows you to analyze the various methods of expansion and identify the most lucrative opportunities, such as expanding into a new market, adding headcount or launching a new product.
How to Use What-If Analysis
What-if analysis is an exceptionally flexible decision-making tool. You can use it to explore any financial question you can model out, which is virtually anything. For example, here are some of the most common use cases for SMBs:
- Pricing and margin sensitivity: Test how different price points impact your revenue, profit margins and customer churn. This helps you strike the right balance to maximize profitability in the context of your competition.
- Expansion or new market entry: Model the potential increase in total revenue and total costs associated with opening a new location or entering a new market. This helps you determine whether it’s worth making the leap.
- Hiring costs and headcount changes: Forecast the costs and productivity increases from expanding your team. This can help inform the timing of hiring decisions, especially when cash flows are tight or runway is limited.
- Managing supply chain disruptions: Model the potential impact of cost increases or supplier delays. This can help you build in an inventory buffer or design other contingencies to keep operations running smoothly.
- Cash flow planning and management: Project cash flow changes if revenues fall short of or grow faster than expectations. This is essential for managing liquidity and planning the best use of working capital.
While these are some typical ways to use what-if analysis, there are countless more. For example, some other variables you might want to test using what-if analysis include inflation, interest rates or even taxes (like tariffs).
What-If Analysis Tools
Programs like Excel and Google Sheets are the traditional what-if analysis tools. Not only are they affordable and widely accessible, but they’re also highly customizable, allowing you to build models from scratch with functions like data tables, goal seek and scenario manager.
However, spreadsheets carry a steep learning curve. Modeling sophisticated what-if questions may require advanced formulas and careful structuring. If you don’t have experience building a financial model, you may struggle to do it with spreadsheets.
Even if you do have the expertise, spreadsheets require a lot of manual work. Not only is that time-consuming, but it also comes with the risk of human error. A single typo can throw off your entire model, forcing you to comb through rows of cells for the mistake.
If you’re struggling with any of these issues, you may have outgrown traditional spreadsheets. In that case, scenario planning software can be invaluable.
These solutions are designed to handle complex, multi-variable scenario planning models. Their powerful dashboards often include automation features that make it easier to build models, test assumptions and compare potential outcomes.
It’s also worth considering outsourcing the function to a financial planning and analysis (FP&A) service. Not only are they often better equipped to manage the process, but hiring them also frees you to focus on other valuable tasks.
Step-by-Step: How to Build a Simple What-If Model
Let’s walk through a practical example of Excel what-if analysis to help you understand how the process works. For simplicity’s sake, we’ll use Google Sheets in combination with the free Goal Seek add-on.
1. Define Your Goal
In this case, let’s imagine you want to achieve $100,000 in net income for the year. Your initial plan is to raise your prices by 10%, and you want to determine if that will accomplish your profit goal.
2. Define Your Assumptions
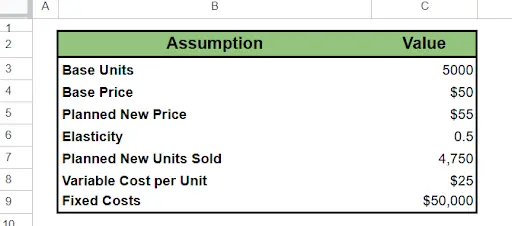
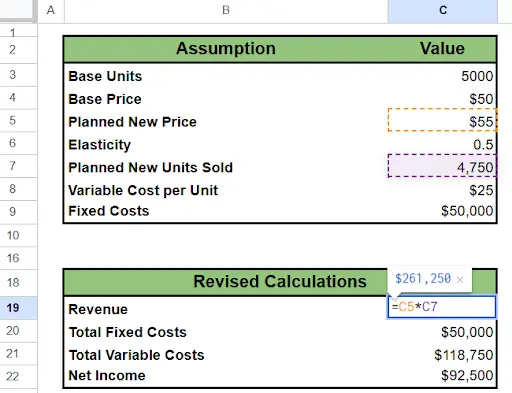
Create a small input table for the variables that will drive the model. We’ll assume you know you can sell 5,000 units at a base price of $50 per unit. You also know that your fixed costs are $50,000 per year and your variable cost per unit is $25.
Based on market research, you estimate that for every 1% increase in price, you’ll lose approximately 0.5% in units sold, resulting in a 0.5 price elasticity of demand.
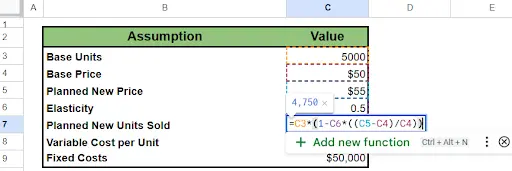
To factor in the price elasticity of demand, you’ll need to create a line item for the number of units you expect to sell after the price increase. Here’s how you should structure the formula so it results in the new estimated units after changing the price.
3. Run Base Calculations
Below your input table, calculate Base Net Income. Make sure Revenue is a function of your base units multiplied by your base price, and use formulas to ensure the Base Net Income calculates automatically by subtracting out total costs.
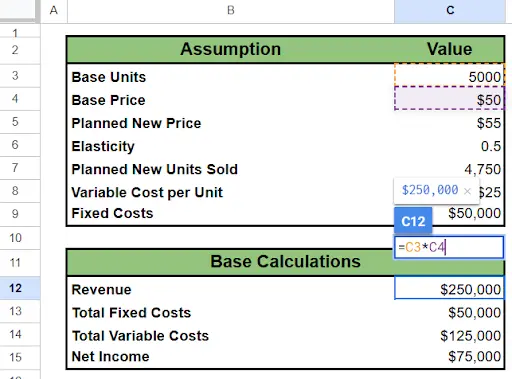
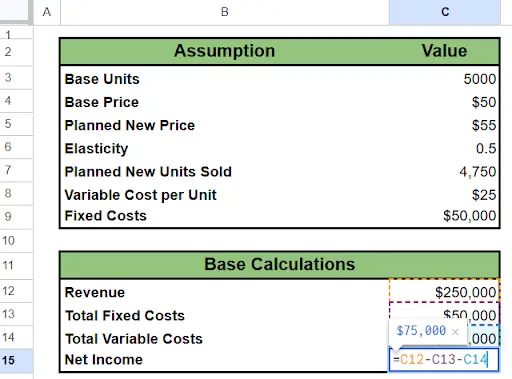
With that, we can establish that you expect to earn $75,000 per year in net income at your current prices.
Next, we need to plot the course to $100,000. To break out that process, create a duplicate calculation for your Revised Net Income. This time, make sure Revenue is a function of Planned New Price and Planned New Units Sold.
4. Use Goal Seek
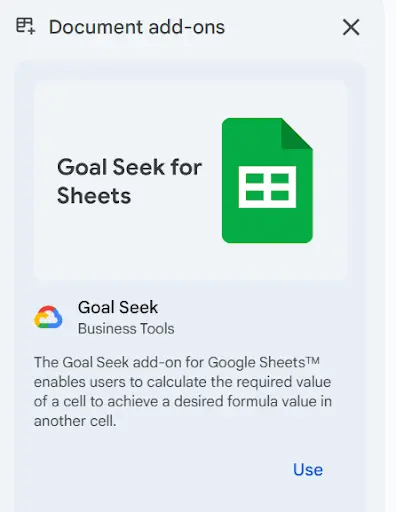
Assuming you’ve installed the Goal Seek add-on to Google Sheets, we can now activate it by clicking Extensions → Add-Ons → View Document Add-Ons. Goal Seek should pop up, and you can click Use.
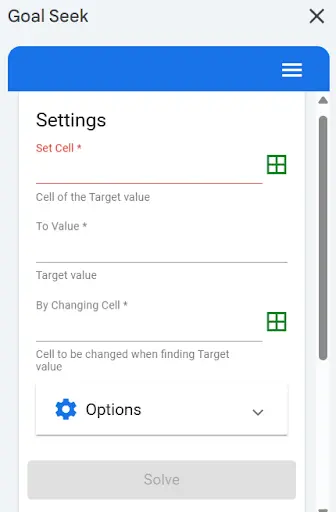
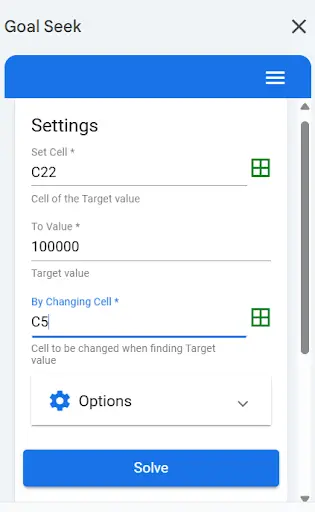
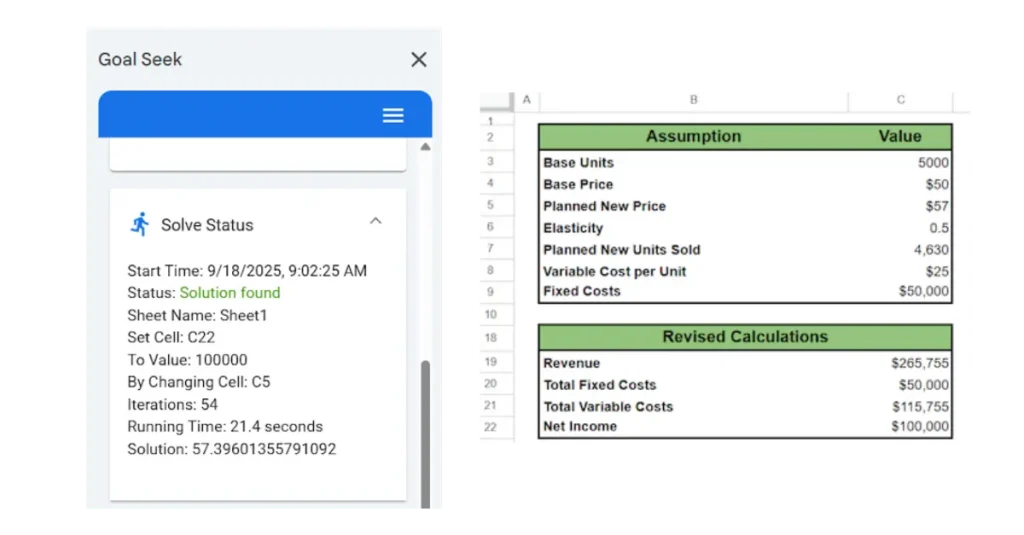
The following prompts should appear. Plug your Net Income cell from the Revised Calculation table into the Set Cell box. Set your target value to $100,000. Tell the tool to achieve that by changing the Planned New Price cell, then hit Solve.
5. Interpret Your Results
Goal Seek will calculate the price point necessary to reach your net income goals. In this case, it found that you need to raise the price per unit from $50 to roughly $57.40 to reach $100,000 in net income. This will result in a sales volume of 4,630 units.
Outsource What-If Analysis With Paro
What-if analysis can be one of the most challenging aspects of financial management, especially as your business grows in size and complexity. It’s also one of the most valuable, helping to inform both short-term tactics and long-term strategy.
If you’d like support in building a financial model capable of answering your “what if” questions, Paro’s FP&A services can help. Schedule a consultation today to connect with a fractional expert whose experience matches your needs.


